In today’s information age, data is a priceless resource for driving innovation, productivity gains, and business expansion. However, there are substantial obstacles to organizing, preserving, and utilizing this resource due to the enormous volume and complexity of data generated daily.
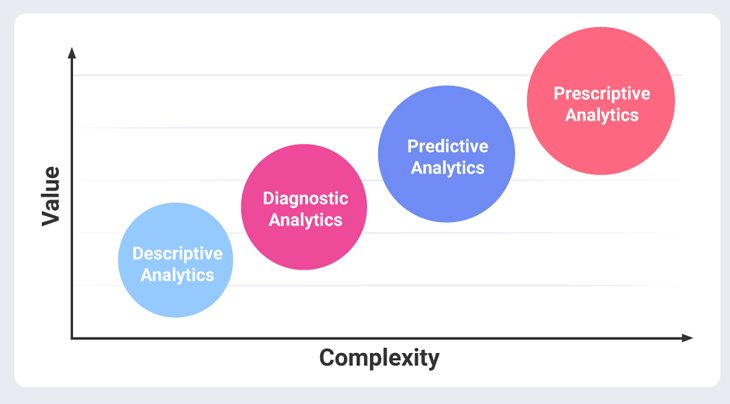
Businesses, organizations, and researchers in today’s data-driven world all want better understanding and more precise forecasts so they can make better decisions. The emergence of advanced analytics as the primary enabler is due to the breadth and depth of its many advanced.
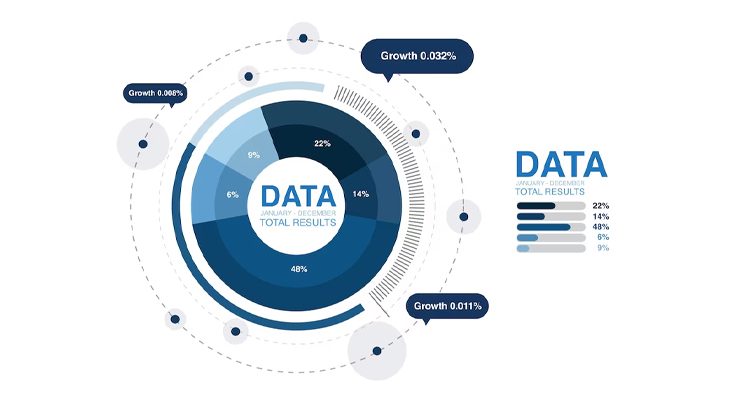
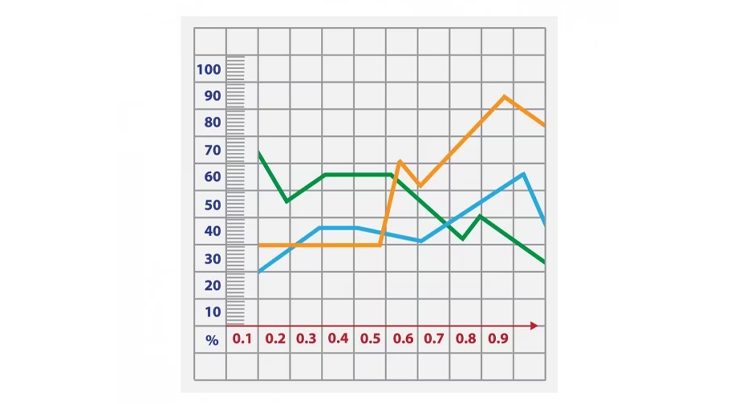
Today’s data-driven society relies heavily on effective data visualisation techniques. It’s the process of using visuals to distil massive amounts of data into digestible, aesthetically appealing information. Data visualisation helps people (decision-makers, analysts, the general public) make sense of large volumes.
Cross-tabulation, often known as contingency tables or cross-tabs, is a powerful method of data analysis for revealing meaningful relationships between different types of data. Data organisation using cross-tabulation aids academics, statisticians
In today’s digital era, surveys are an essential tool for acquiring information and understanding from a specific population. In order to effectively plan, execute, and analyze surveys, researchers and institutions rely heavily on survey programming.
Technology’s unrelenting advance has ushered in an age of automation, which has altered virtually every aspect of human life. Automation is the process of completing activities or processes with little human interaction via the use of technology and artificial intelligence.

